


Hundreds Charts: Uses, Limitations, and Common Misconceptions

This post continues my Math Manipulatives That Count series, which began last week with Math Manipulatives That Count: The Right Tool for Thinking. Across the series, I am looking closely at familiar classroom tools: What does each one make visible? What might it hide? What mathematical thinking does it make possible? This week’s familiar tool is the hundreds chart. We use hundreds charts to count, notice patterns, skip-count, compare numbers, and explore what happens when we add or subtract 1 or 10.
However, no representation is neutral. The way a chart is organized draws children’s attention to some relationships and away from others. That is why it matters whether a chart runs from 1–100 or 0–99—and why neither version should substitute for place-value reasoning.
What a Hundreds Chart Makes Easy to See
On a conventional 1–100 hundreds chart, moving one space to the right usually means adding 1, moving one space to the left usually means subtracting 1, and moving vertically changes the number by 10. Children can color multiples, compare rows and columns, and describe repeated patterns. Those are legitimate uses. A hundreds chart can support counting sequences, skip-counting, locating numbers, and noticing regularity in our base-ten system.
I get the appeal. Years ago, I had my husband make a life-size hundreds chart. I carried it on my two-hour commute from Toms River to my job as an Elementary Math Coordinator on the Upper West Side. Children stood on it, moved across it, and talked about every pattern we could find. The chart created movement, conversation, and genuine curiosity. I would still value all three.

I also used this anchor chart with the life-size chart, teaching +10 and −10—and even +9 and −9—as movements on the grid. Looking back, I initially wondered whether those movement rules had shifted children’s attention toward spatial shortcuts instead of place-value reasoning. After revisiting the photo, however, I can see that the discussion did not stop with movement. We connected +10 and −10 to changes in the tens digit while the ones digit stayed the same, then used those relationships to reason about +9, +8, −9, and −8 through compensation. In this lesson, the chart served as a bridge from spatial movement to place-value and computational reasoning. The risk is not movement language itself; it is allowing the reasoning to stop there.

When Consecutive Numbers Land on Different Rows
The problem is not that a hundreds chart shows patterns. The problem comes when we treat its layout as though it were the number system itself. On a 1–100 chart, 9 and 10 are one apart and appear next to each other at the end of the first row. But 10 and 11, also one apart, appear on separate rows—with 10 at the far right of one row and 11 at the far left of the next. The chart cannot keep every pair of consecutive numbers side by side: whenever counting moves to a new row, the next number jumps from the far-right edge to the far-left edge below.
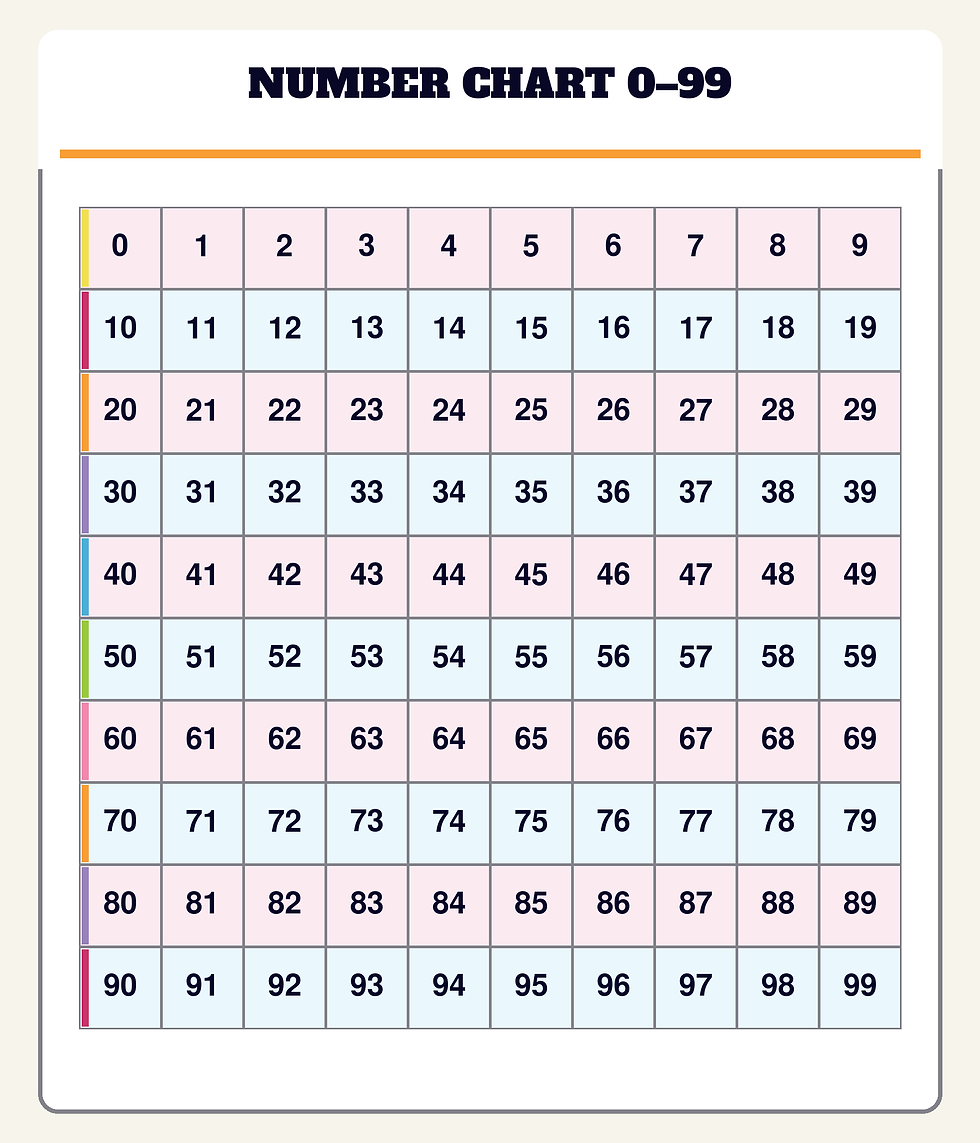
A 0–99 chart has the same wraparound limitation: 9 and 10 are still one apart but sit on separate lines. It does, however, organize each complete decade in one row. The 10–19 row is the teen family; 20–29 is the twenties family; 30–39 is the thirties family. The tens digit stays constant across a row while the ones digit changes. Zero also appears where the system begins, rather than 100 being added at the far end as though it belongs to the same set of two-digit numbers.
Number Charts and the 10 More or 10 Less Standard
CCSS.Math.Content.1.NBT.C.5 asks first graders: “Given a two-digit number, mentally find 10 more or 10 less than the number, without having to count; explain the reasoning used.”
A hundreds chart can display the result: numbers 10 apart are aligned vertically. But that visual shortcut does not, by itself, meet the standard. A child can move down one square and say 67 without reasoning that 57 is five tens and seven ones, that one more ten makes six tens, and that the seven ones remain unchanged. The standard calls for a mental relationship and an explanation—not merely a successful move on a grid.
This is the important distinction: A 0–99 chart can make decade families and the relationship between the tens digit and each row easier to see, but the chart alone does not guarantee place-value reasoning. Teachers still need to shift students’ attention from position to number structure: What changed? What stayed the same? How do you know without counting squares?
How a July Conversation Changed What I Saw in February
Last month, a conversation with my 7-year-old niece, who is getting ready to start second grade, made me reflect on something I had seen months earlier. I shared more about that conversation in my blog post, Math Instructional Strategies – Using Checks for Understanding.
During our conversation, she had trouble finding 10 more mentally. I immediately thought back to my February visit to her classroom and the hundreds-chart game I had watched students play. It made me wonder whether practice moving up and down the chart had helped her find answers without giving her enough opportunities to reason about tens and ones.
I don’t see that as a failure on her teacher’s part. She was using materials from the curriculum. For me, it was a reminder to look beyond whether students can complete a task and ask what mathematical thinking the tool is supporting.
During that visit, students were playing a Flip and Cover activity from the i-Ready curriculum. They flipped a counter onto the chart, circled the number it landed on, found the number that was 10 more and the number that was 10 less, and covered each with a different color. It was engaging, visual, and based on the +10/−10 pattern built into a hundreds chart.

The game can be useful for recognizing and practicing patterns. But successfully covering the correct numbers does not necessarily show that a student can mentally find 10 more or 10 less and explain why. To gather evidence of place-value reasoning, pause the game and ask students to predict before looking, explain why the ones digit stays the same, represent the starting number with tens and ones, or solve a new example after the chart is covered.
Using Number Representations More Intentionally
Recognizing what a representation highlights—or hides—is only the first step. The next is designing opportunities for students to compare representations, connect what they see to place-value reasoning, and eventually reason without relying on the tool. The following activity uses the 0–99 chart and Numeral Roll to make those differences visible.
Compare What the 0–99 Chart and Numeral Roll Reveal
The Numeral Roll is a number path that runs from 0 to 99. In some curricula, including i-Ready, students use number paths before working with this type of number-grid activity. Reorganizing the Numeral Roll into a 0–99 chart allows students to examine how a change in layout affects what they notice—especially when reasoning about 10 more and 10 less.
To learn more about using a Numeral Roll, watch Kristie Manley’s video.
Build the Numeral Roll. Print the pages on two colors of paper, cut apart the sections, and connect them in numerical order. Use the complete 0–99 path or select a shorter section that fits the lesson.
Notice what the number path reveals. Consecutive numbers remain beside one another, so the Numeral Roll makes counting forward and backward and crossing from one decade to the next easy to follow. However, numbers that are 10 apart are not vertically aligned as they are on a chart.
Reorganize the path as a grid. Give students part of the Numeral Roll and ask them to arrange it as part of a 0–99 chart. Discuss what becomes more visible when numbers with the same ones digit line up in columns.
Compare 10 more and 10 less. Choose a number and locate 10 more or 10 less on both representations. On the chart, students can see the vertical pattern immediately. On the Numeral Roll, they can see the distance between the numbers within the continuous sequence.
Connect movement to place value. Movement language can be a productive starting point when it is deliberately connected to the digits and to strategies such as compensation. Ask: What changed in the number? What stayed the same? How do the tens and ones explain why the difference is 10?
Discuss the tradeoffs. The Numeral Roll preserves the order and adjacency of consecutive numbers. The 0–99 chart highlights decade families, numbers with the same ones digit, and repeated +10/−10 relationships. Neither representation does all of the mathematical thinking for students.
The goal is not to decide that one tool is better. It is to help students understand what each representation makes visible, recognize what it may hide, and choose the tool that supports the relationship they are investigating.
More Ways to Use Number Charts Intentionally
Name the purpose. If the goal is counting, locating numbers, or identifying multiples, a 1–100 hundreds chart may be perfectly appropriate.
Match the tool to the idea. If the goal is connecting written numbers to decade families, begin with a 0–99 chart and explicitly discuss the role of zero.
Discuss the row breaks. Ask why 10 and 11 are far apart on a 1–100 chart—and why 9 and 10 are far apart on a 0–99 chart—even though each pair contains consecutive numbers. Invite students to imagine a number path that preserves adjacency.
Ask for predictions before movement. A student should name 10 more or 10 less and explain the digit relationship before checking on the chart.
Plan for independence. Pay attention to whether the representation is helping students notice relationships or simply allowing them to continue counting by ones.
Listen for place-value language. “I moved down” describes what a student did on the tool. Follow it with questions that connect movement to number structure: What changed in the tens? What stayed the same in the ones? How could that relationship help with 9 more or 9 less?
Know When to Fade Both Representations
There is also a point when both representations need to recede. A Numeral Roll can preserve the adjacency of consecutive numbers, while a hundreds chart can make patterns involving 10 more and 10 less easier to see. But students can become dependent on either tool and continue counting by ones when more efficient place-value strategies are within reach.
I have noticed this with my niece, and Maureen O’Connell describes a similar pattern in “Choosing Math Tools and Representations that Work: ‘100 Chart-less in Grade 2.’” Her students used hundreds charts to solve addition and subtraction problems, but many remained tied to counting by ones rather than reasoning with tens and ones.
That does not mean the representations have failed. It means their purpose needs to change over time. Signs of dependency might include counting every square or interval, reaching for the tool even when a relationship is known, or finding the correct answer without being able to explain it through tens and ones. Teachers can move from a full number path or chart to a partial representation, ask students to predict before checking, invite them to explain relationships through place value, and eventually solve without the tool. The goal is flexible reasoning that students can carry with them when the representation is no longer present.
The Chart Is a Tool, Not the Mathematics
Number charts can support productive noticing, movement, practice, and discussion. A 1–100 chart can make counting patterns and multiples easier to see, while a 0–99 chart can make decade families and the structure of two-digit numbers more visible. Both representations can support mental reasoning and explanation, but either can become limiting if students continue to rely on it after they are ready to reason more flexibly. The goal is to help students move from a pattern on the page to a relationship among tens and ones.
Curriculum materials are valuable resources, and teachers’ knowledge of the standards and professional judgment help determine how those materials are used. Chart navigation can be a useful entry point when teacher questions extend it into mental place-value reasoning and flexible strategies. If your school or district wants to strengthen this kind of standards-based decision-making, explore the January Standards Summits for grades K–2, 3–5, and 6–8 and start a conversation about professional learning that fits your teachers and students.


Comments